
저번 포스팅에서는 node-exporter를 통해서 리눅스 시스템을 모니터링하는 방법을 알아봤다. 이번에는 심층적으로 redis를 모니터링해 보자.
본론
먼저 소스 코드의 예제는 아래와 같다. 궁금하면 직접 docker-compose를 통해서 빠르게 실행해 볼 수 있다.
- Github Example : https://github.com/marsboy02/redis-exporter-monitoring
GitHub - marsboy02/redis-exporter-monitoring: redis-exporter를 사용해서 모니터링하는 소스 코드의 예제입니다
redis-exporter를 사용해서 모니터링하는 소스 코드의 예제입니다. Contribute to marsboy02/redis-exporter-monitoring development by creating an account on GitHub.
github.com
이제 하나하나씩 살펴보자.
docker-compose.yml
services:
  redis:
    image: "redis:latest"
    container_name: "redis"
    ports:
      - "6379:6379"

  redis-exporter:
    image: "bitnami/redis-exporter:latest"
    container_name: "redis-exporter"
    environment:
      - REDIS_ADDR=redis:6379
    ports:
      - "9121:9121"
    depends_on:
      - redis

  prometheus:
    image: "prom/prometheus:latest"
    container_name: "prometheus"
    ports:
      - "9090:9090"
    volumes:
      - ./prometheus.yml:/etc/prometheus/prometheus.yml
    depends_on:
      - redis-exporter

  grafana:
    image: "grafana/grafana:latest"
    container_name: "grafana"
    ports:
      - "3000:3000"
    depends_on:
      - prometheus
    environment:
      - GF_SECURITY_ADMIN_PASSWORD=admin
    volumes:
      - grafana-storage:/var/lib/grafana

volumes:
  grafana-storage:
먼저, docker-compose.yml의 구성은 위와 같다. 총 네 개의 컨테이너를 띄우며, 우리가 중점적으로 확인하고 싶은 것은 redis이다. 이에 맞춰 redis를 띄우고, exporter, prometheus, grafana 이 세 가지를 함께 띄어준다.
네 가지의 컨테이너의 depends_on을 보면, redis <- redis-exporter <- prometheus <- grafana가 물고 뜬다. 의존성은 위와 같은 순서대로 물고 뜨게 된다.
당연하게도 여기서 prometheus가 volumes로 prometheus.yml을 물고 뜨기 때문에, 같은 디렉터리에 설정 파일을 추가해줘야 한다. 다음과 같이 추가한다.
global:
  scrape_interval: 5s

scrape_configs:
  - job_name: "redis"
    static_configs:
      - targets: ["redis-exporter:9121"]
이번에는 redis에 간단하게 데이터를 집어넣는 스크립트를 짰다. python 스크립트로 redis라는 패키지를 통해서 random 한 데이터들을 집어넣는 스크립트이다. ( annoying-redis.py ) redis의 견고함을 확인해보기 위해서 scrape_interval을 5s로 주었다.
간단한 설명이 끝났으니, 이제 다음 명령어로 docker-compose를 실행시킨다.
docker-compose up -d
이제 UI를 통해서 진행해 보자.
redis-exporter
redis-exporter의 포트 바운딩을 9121로 했기 때문에, localhost:9121에서 직접 어떤 내용들이 매트릭으로 나오는지 확인할 수 있다.
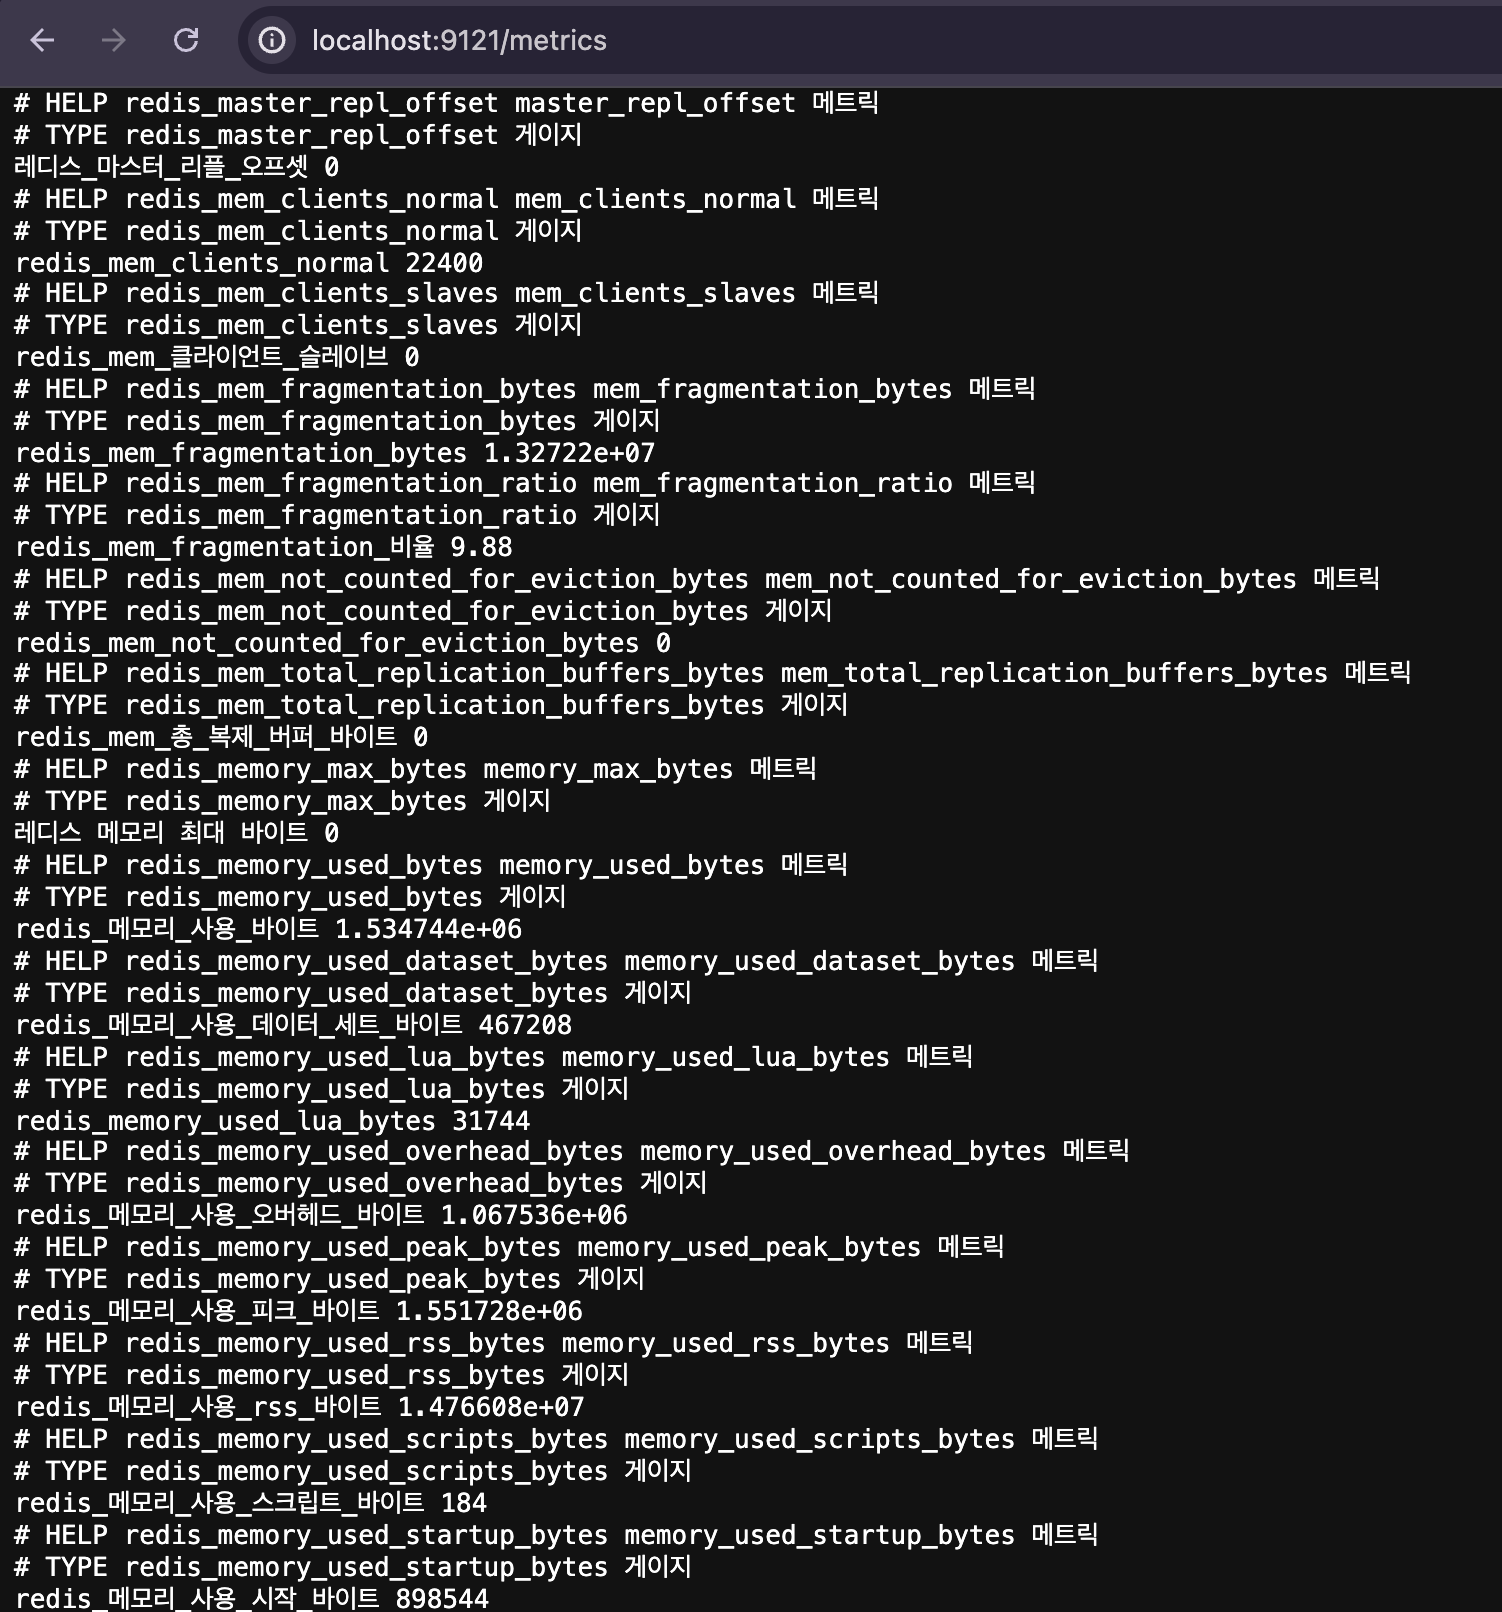
위 화면은 localhost:9121에 접속하여, 한국어 번역과 함께 화면을 좀 내려서 redis에 관한 어떤 내용들이 매트릭으로 나오는 지 확인한 것이다. redis에 어떠한 부분을 확인해야 할 필요가 있을 때, 이 metrics를 참고하여 자유롭게 설정할 수 있다.
그 후, 프로메테우스(localhost:9090)에 접속하여, 직접 하나씩 쿼리 할 수 있다.
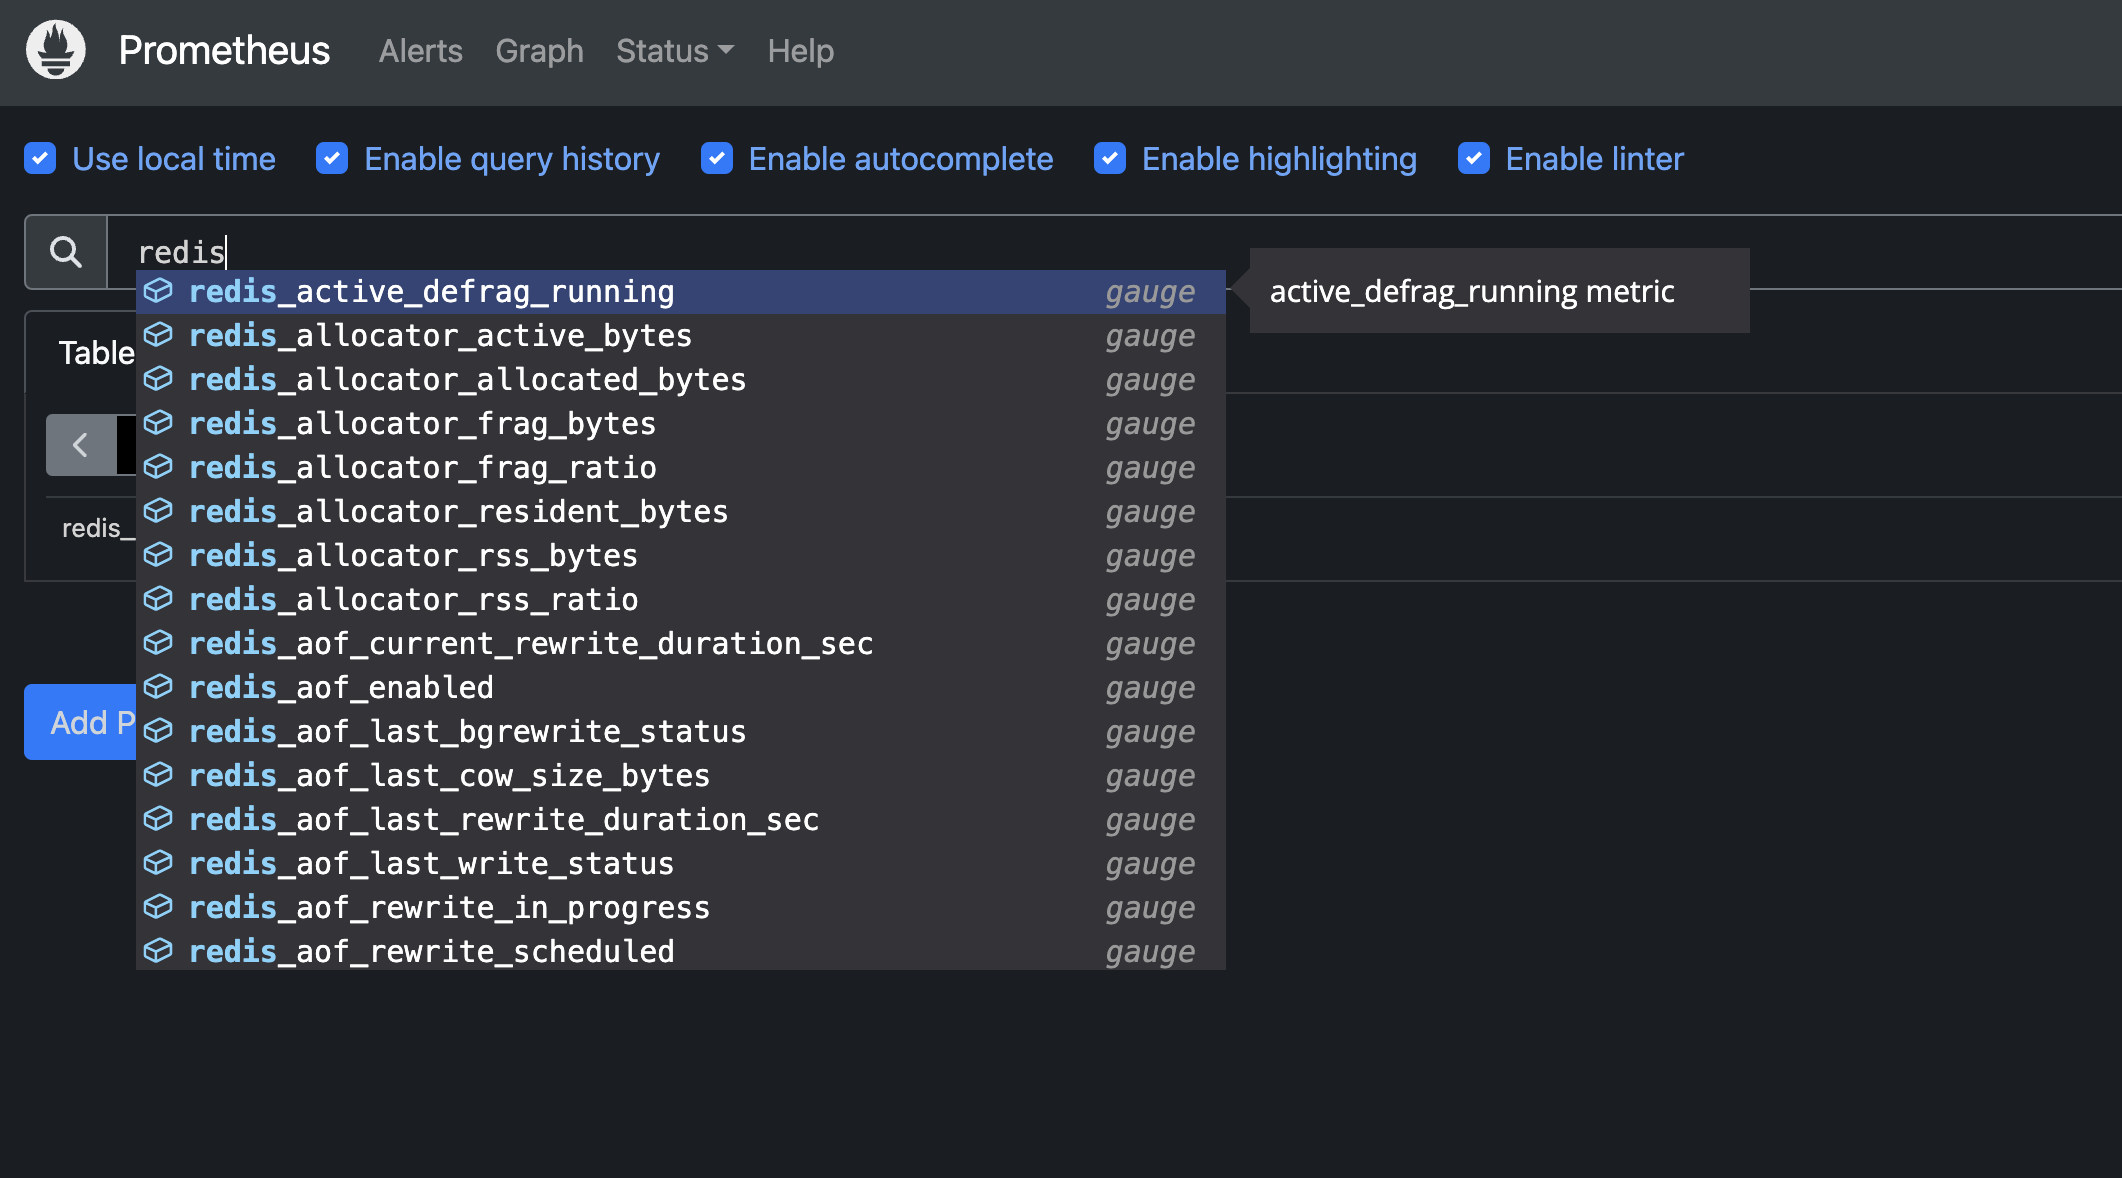
하지만, 시계열 데이터 시각화의 꽃은 아무래도 grafana이다. 과연 레디스를 모니터링해 주기 좋은 대시보드가 있을까? grafana labs dashboard에서 redis라고 검색하면, 가장 유명한 다음 대시보드 프리셋을 확인할 수 있다!
- Grafanalabs dashboards : https://grafana.com/grafana/dashboards/
Grafana dashboards | Grafana Labs
No results found. Please clear one or more filters.
grafana.com

위와 같은 그라파나 대시보드 홈페이지에서 다양한 사용자들이 만들어 둔 프리셋을 확인할 수 있다. 필자는 redis라는 키워드로 검색하여 제일 상단에 뜨는 대시보드 프리셋의 id인 11835를 사용할 것이다.
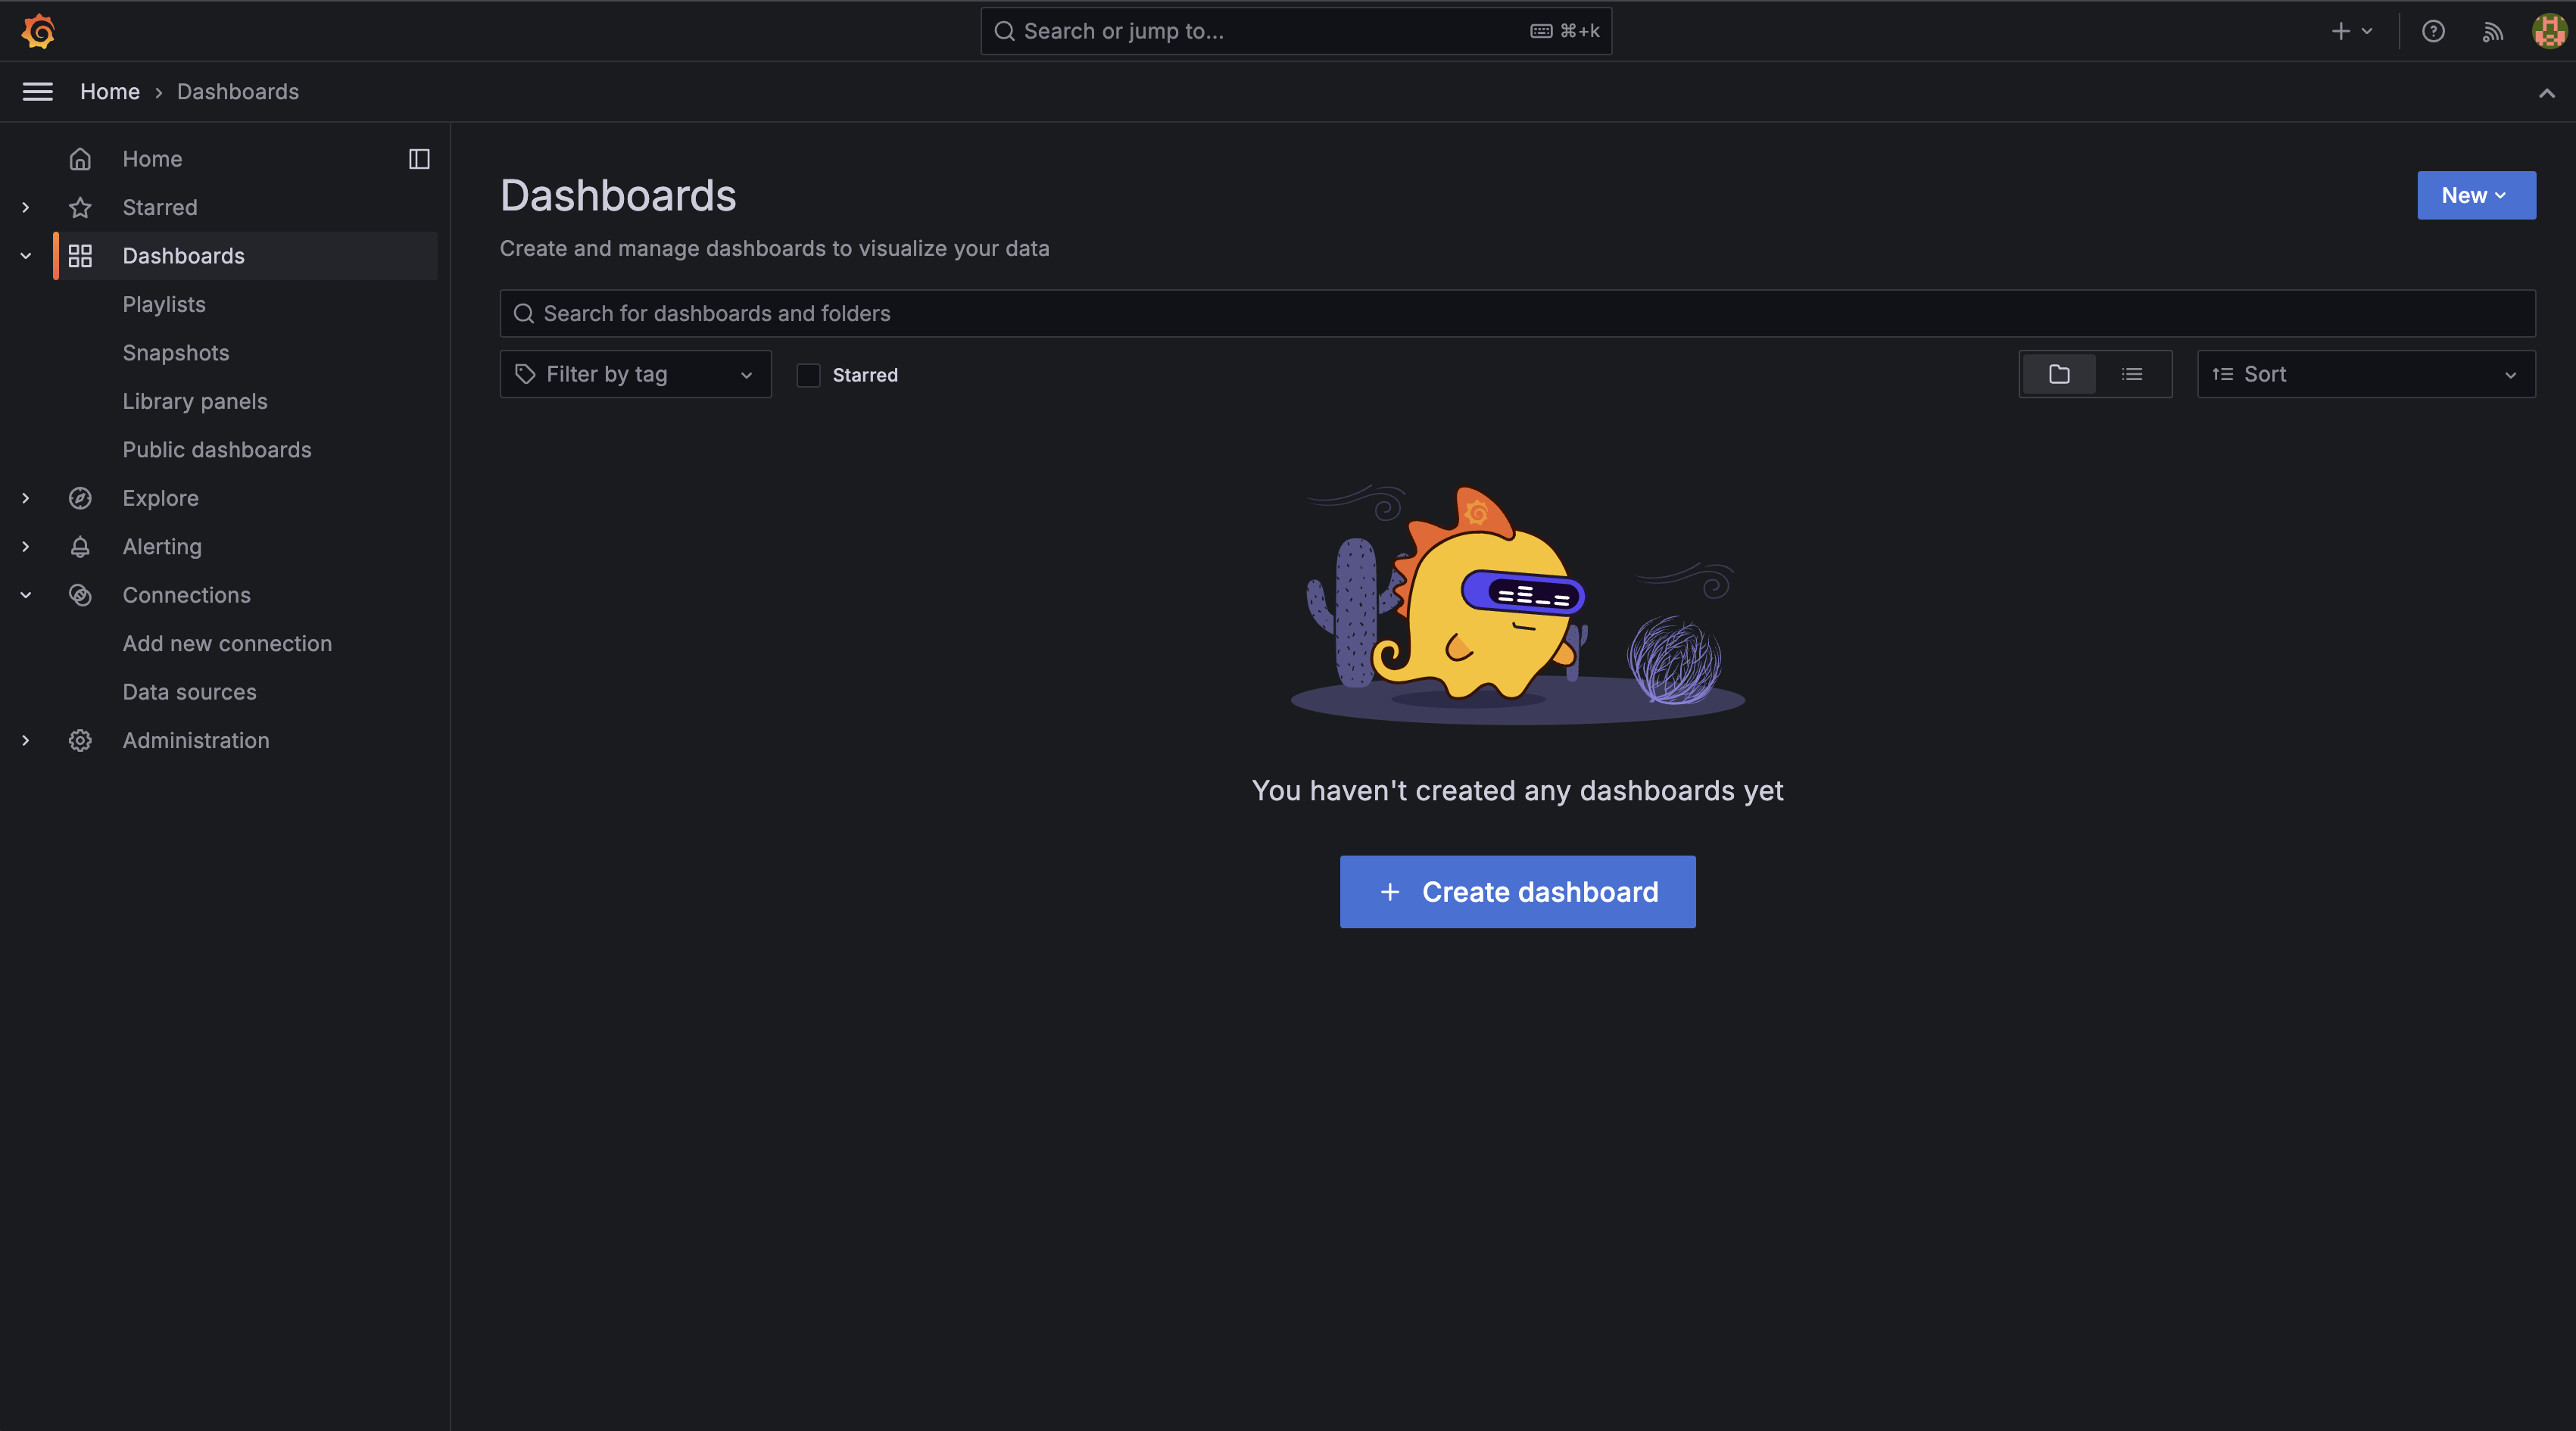
이제 그라파나(localhost:3000)에 접속하여 default 계정(admin/admin)으로 로그인하여, 먼저 Connections-Data source에서 prometheus를 추가해 준다.
그다음으로는 프리셋 대시보드를 추가하기 위해 Create dashboard를 누르고 Import dashboard 그리고 11835를 입력한다.

load를 누르고 나서 import 하면 다음과 같은 대시보드를 볼 수 있다.

지금 이 상황만으로는 redis가 어떤 상황인지, 어떤 고비인지 알기 어렵다. 따라서 annoying-redis.py라는 간단한 파이썬 스크립트를 추가했다. 아래와 같은 간단한 스크립트이다.
import redis
import random
import string
import time

def random_string(length=10):
    letters = string.ascii_lowercase
    return ''.join(random.choice(letters) for i in range(length))

def main():
    r = redis.Redis(host='localhost', port=6379, db=0)
    try:
        while True:
            key = random_string(10)
            value = random_string(50)
            r.set(key, value)

            print(f"Set {key} -> {value}")
            time.sleep(0.01)
    except KeyboardInterrupt:
        print("Stopped by user")
    except Exception as e:
        print(f"Error: {e}")

if __name__ == "__main__":
    main()
redis라는 라이브러리가 있어야 하니, 개인적으로 pip를 통해서 다운로드해도 좋고, 깔끔하게 하고 싶다면 샘플 예제의 readme에 가상환경을 적어두었다.
이제 다음 명령어를 통해서 python 스크립트를 실행하면 많은 데이터를 쏟아내는 것을 확인할 수 있다.
python3 annoying-redis.py
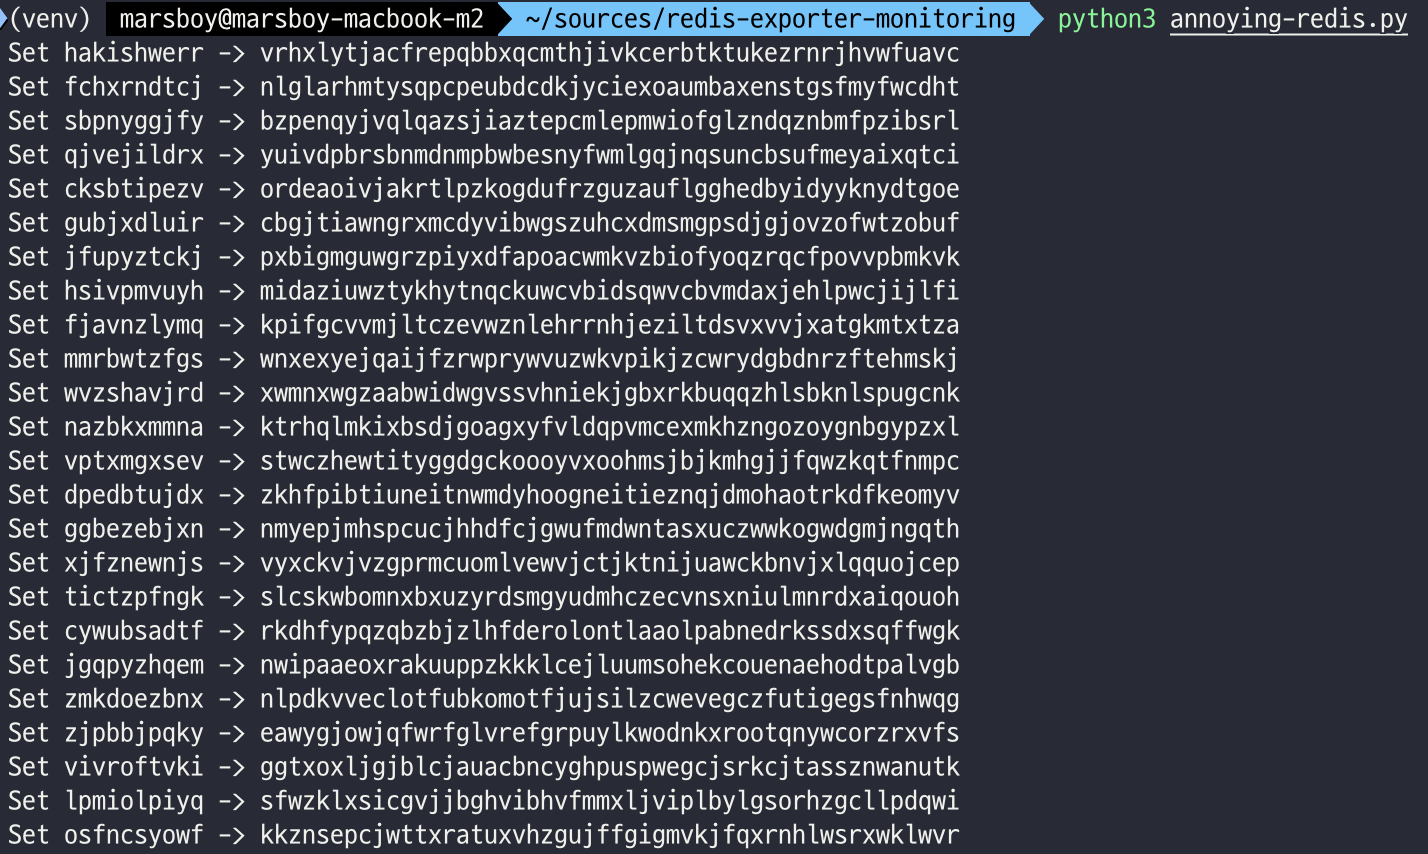
이제 해당 스크립트를 수행하고 나서 Ctrl+C로 종료하고, 조금 있다 grafana dashboard를 살펴보면 아래와 같은 폭풍우가 왔다는 것을 확인할 수 있다.
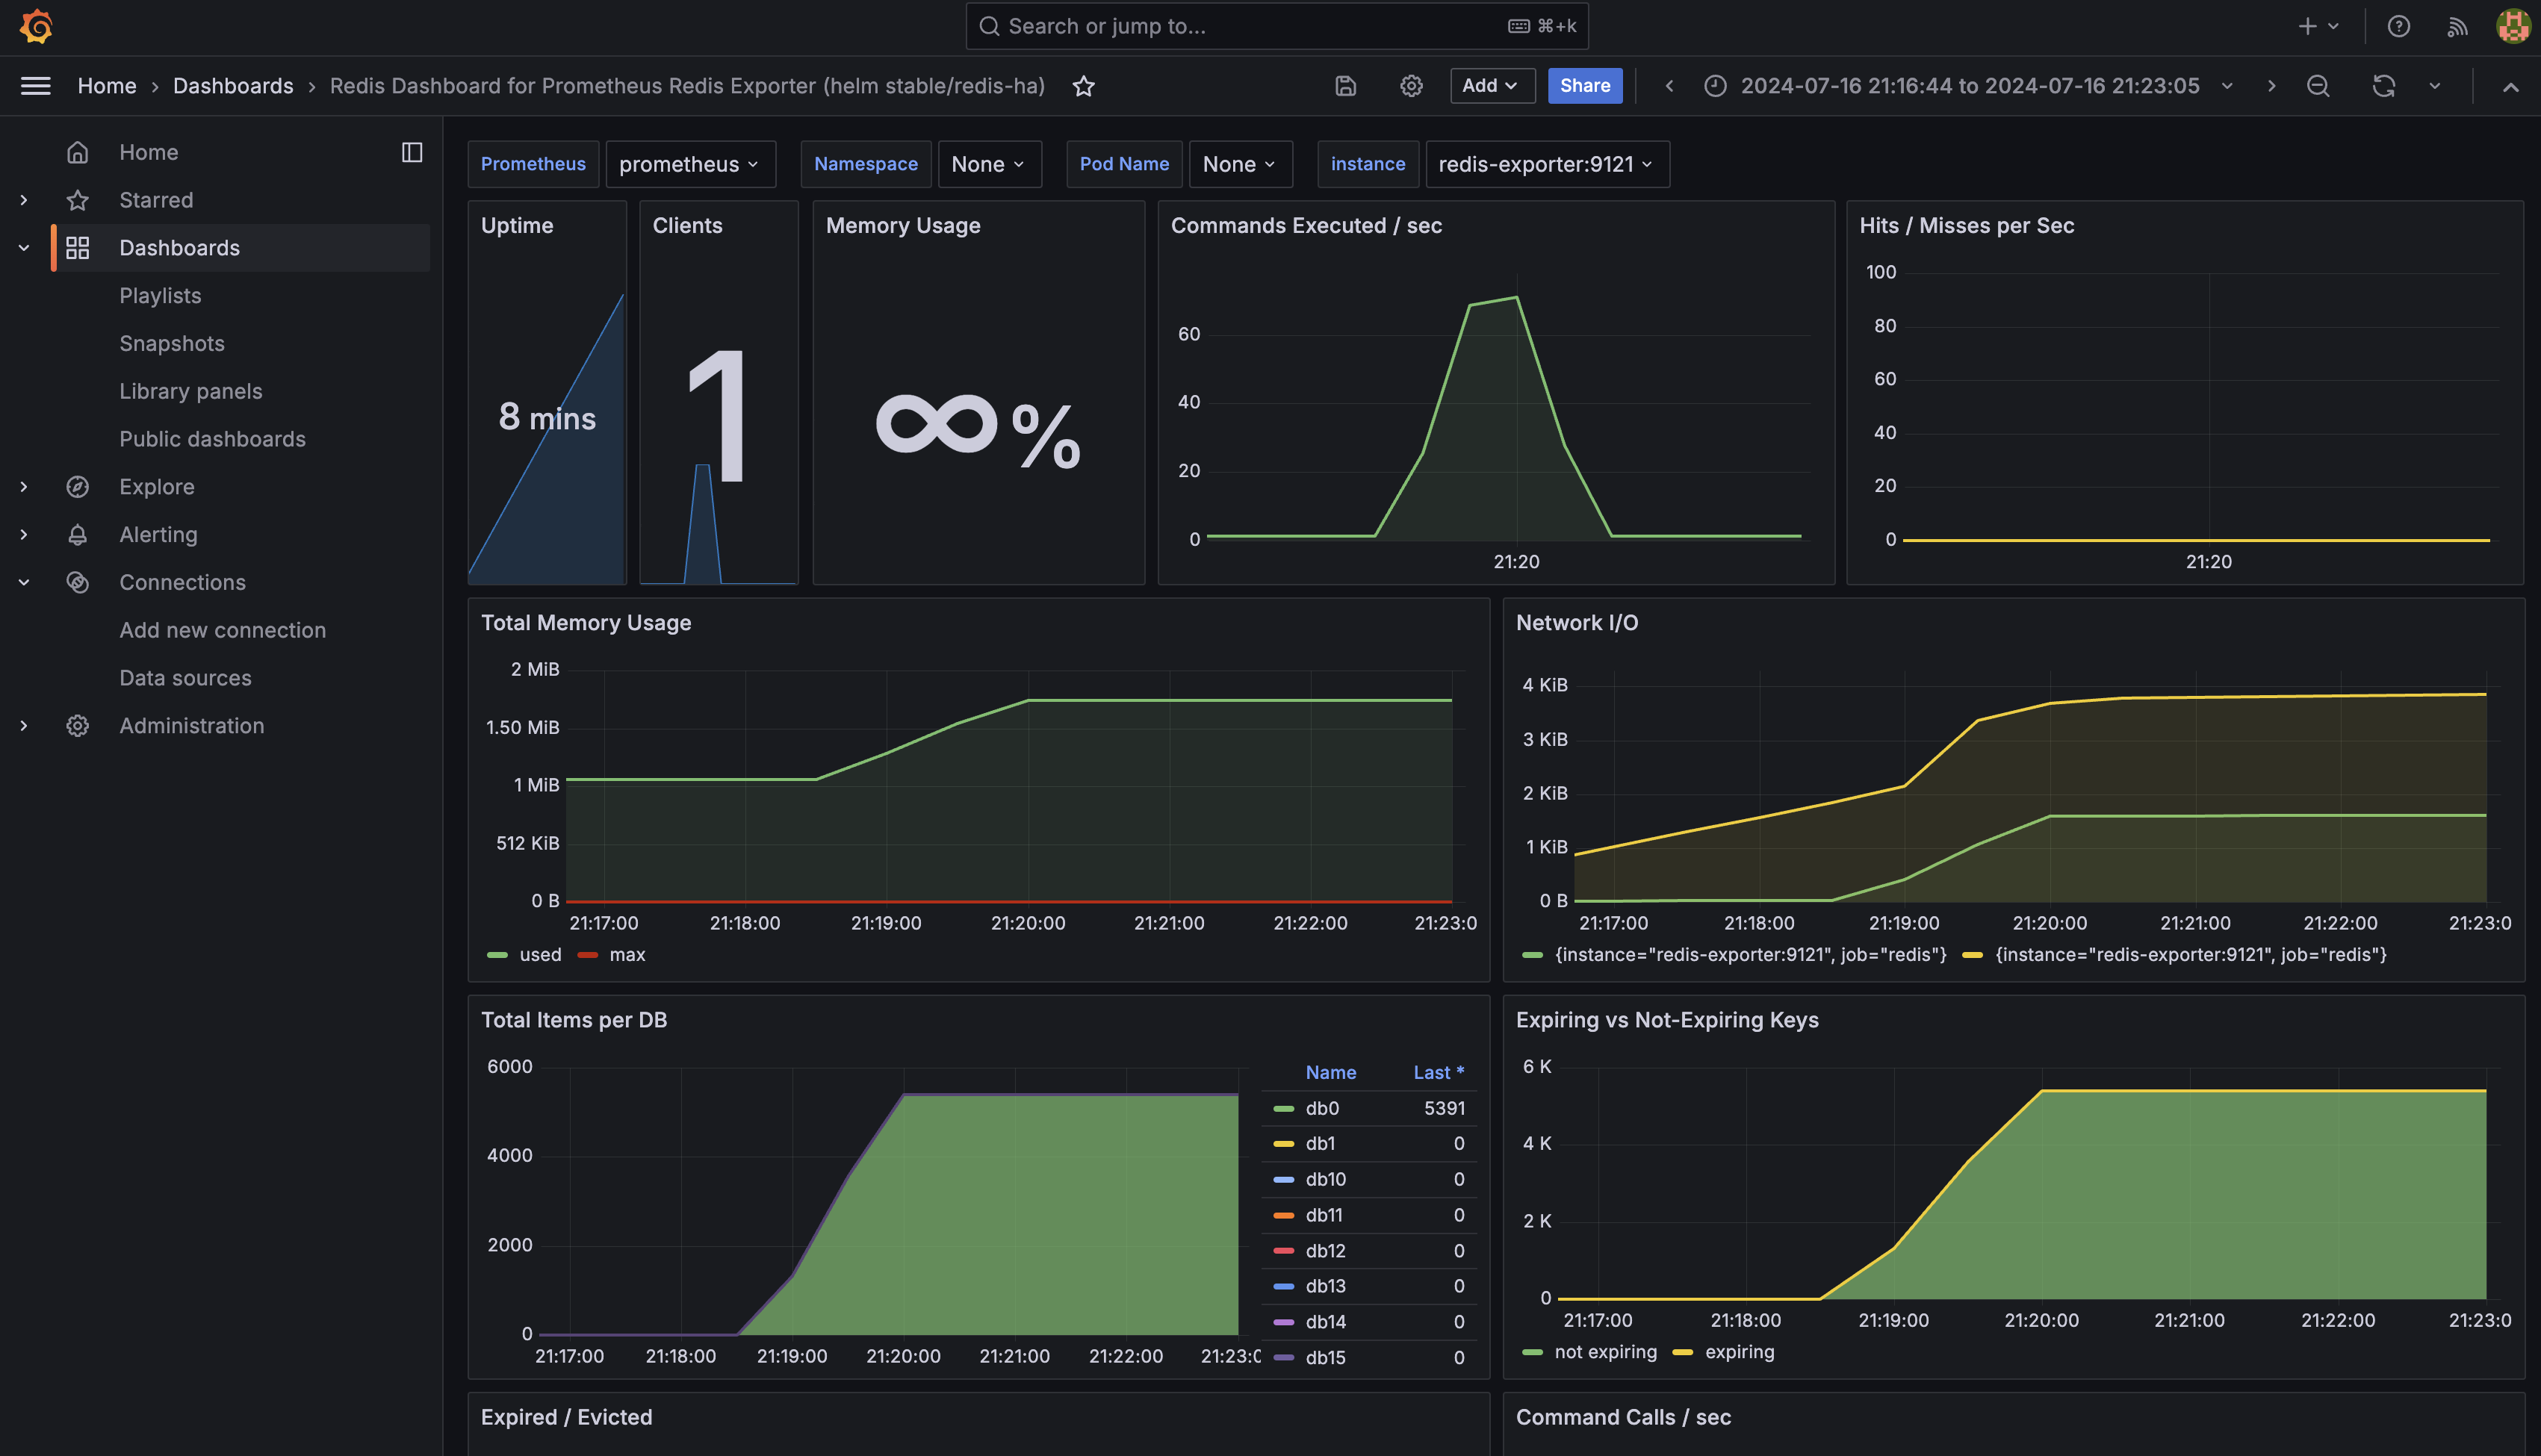
이러한 모니터링을 통해 redis에 어떤 일이 있는지 대강 확인할 수 있다. 이렇게 redis 외에도 다양한 서버 ( nginx, kafka etc.. ) 등이 다양하게 존재한다. 이러한 모든 서버들을 모니터링하는 것을 만드는 것은 크게 어렵지 않다. 왜냐하면 dockerhub 및 grafanalabs를 참고하면 손쉽게 exporter 및 dashboard를 만들 수 있다.
마치며
그라파나 대시보드는 꽤 이쁜 것 같다.
'DevOps > monitoring' 카테고리의 다른 글
| 관측성의 세가지 축(Three pillars of observablility)에 대해서 (0) | 2025.09.06 |
|---|---|
| Metabase(메타베이스)를 사용한 데이터 시각화 플랫폼 (0) | 2025.03.23 |
| promethous와 grafana로 linux 시스템 모니터링 (2) | 2024.07.14 |
| Prometheus란? (1) | 2024.07.14 |
